Organizing Complex Data Systems
By the 21st Century we developed Graph Databases to organize large data systems by context, position and relationship. These networked data systems have advanced in sophistication and complexity spanning fraud detection, recommendation engines, route finding, dynamic pricing and modeling natural biological systems and many more. We can’t always control the expansion of networks and information, but we can incorporate their complexity into the data architecture so that we can traverse their webbed edges with increased automation, flexibility and speed.
Graph Databases are rooted in mathematical science. Graph Theory is the “…way to formally represent a network, which is basically just a collection of objects that are all interconnected.” Placing information in the vertices and connecting those nodes along the edges can uncover well-worn paths and discoveries.
Directional and Undirectional Graphs
Graphs can be directional or undirectional. Undirectional graphs contain nodes; either node can be an origin and the edges will have no arrows. In biology, this would be called mutualistic symbiosis. An example of an undirectional biological graph illustration is a plant’s roots feeding sugars to fungi and the fungi feeding nutrients to the plant’s roots. This graph would have an edge without an arrow because both nodes can simultaneously serve as nutrient or energy origins and destinations.

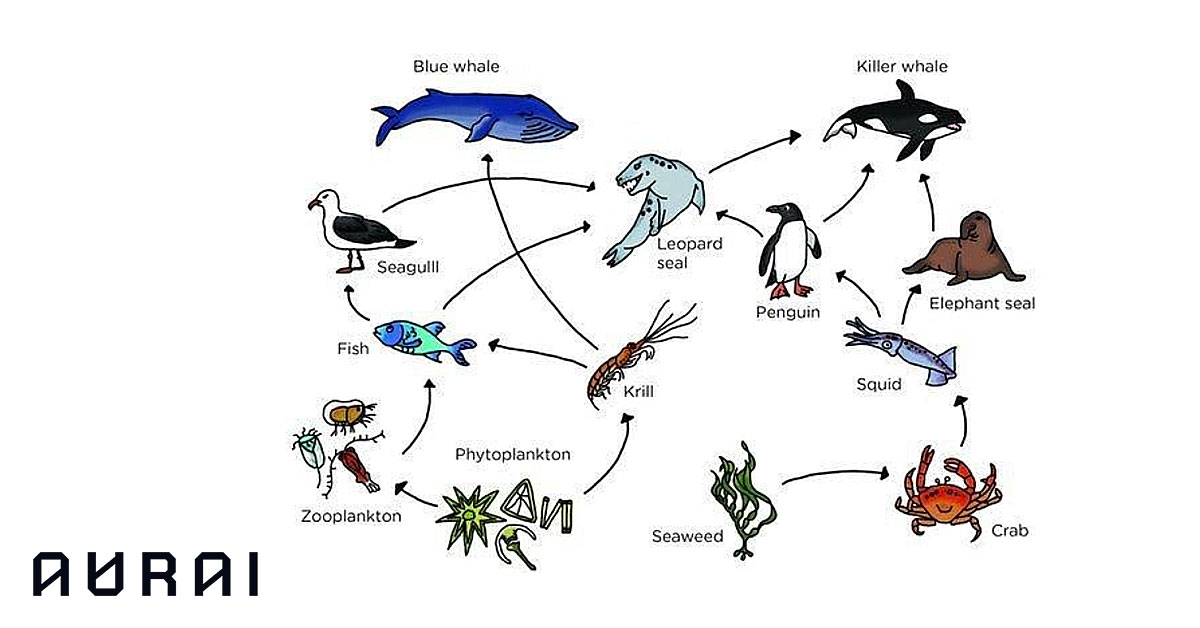
For a food web based on predatory symbiosis, directional graph models are more useful. A marine food web is a simple model for a graph database. Each organism node represents either an origin or a destination according to the link’s arrow.

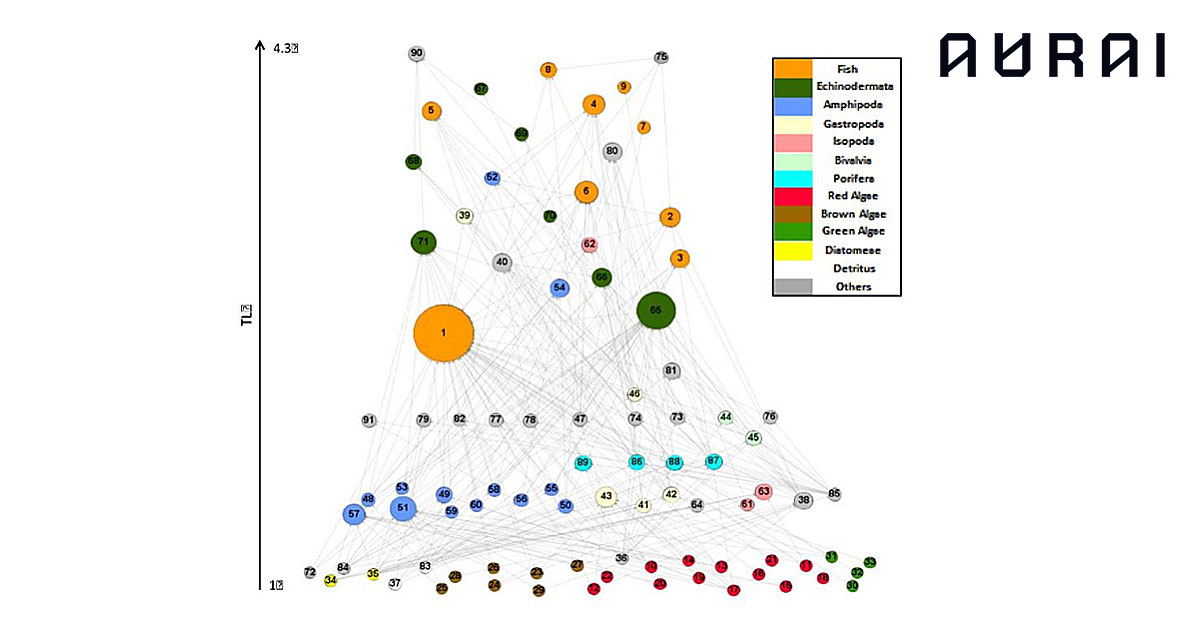
These are all predator and prey relationships. The edges are calories that always move in one direction; the fish is never going to hunt the leopard seal. The directional marine food web model can be scaled up easily with large data inputs into larger and more diverse classifications. The graph database will keep a complex table of information in each node and store the links between the nodes. With the organisms divided into taxonomic classes, each node represents a data bank containing tens of thousands of organisms representing various species.

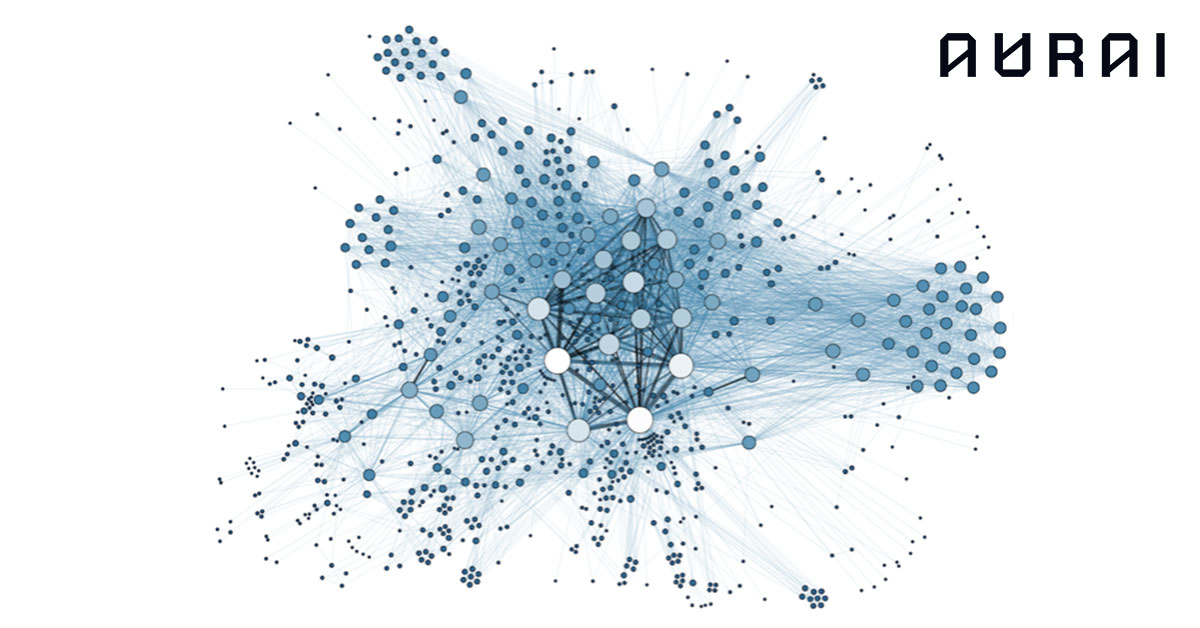
The data is literally stored as a network of entities/nodes and their connections. Traversing specific queries along large information sets becomes a lot faster with the nodes labeled and quantified, and edges established. This means fewer programming commands and cuts down on query processing time. With very large datasets, the storage network appears three-dimensional – much like a galaxy, molecule or ecosystem of information.

Aurai’s Expansion Into Graph Database Modeling
Staying at the forefront of data consultancy and education requires incorporating and mastering the newest technologies. Two years ago our Data Engineer, Levi, was tasked with developing practical and efficient solutions for the proliferation of data collected, stored and analyzed by Dutch municipalities.The municipalities were looking for a data system that could connect different nodes and analyze them in relation to their direct connections and larger networks.
Visualizing a Network of Datapoints
The Tilburg municipality was not quite satisfied with data system solutions offered by other cities, and so Levi, a specialist in Cognitive Science and Artificial Intelligence, looked deeper into Azure, the cloud platform adopted by Tilburg, and got familiar with their graph database platform, Cosmos DB. This organic model visualized the entire network of datapoint nodes and edges. It was new but comprehensive and scalable. With cloud platforms expanding the limits of data storage, the complexity could be incorporated into the model and data infrastructure, rather than relying on laborious paragraphs of commands and programming. The graph database model led Levi and his team to stringing together a mock police evidence board of data nodes and edges reaching out and centering on many clues, characters and places at once.
Are you ready to, like Levi, turn data into actionable value? Find our vacancies here and join Aurai.